

Dashboard overview
Dashboard Overview, dashboard, analytics, revenue, KPIs, workflow level revenue, attributionDashboard Overview is the first screen of the Dashboard panel. It shows how much revenue, how many orders and how many new users and customers BusinessOnBot brought you.
To open it, go to Dashboard → Dashboard Overview.
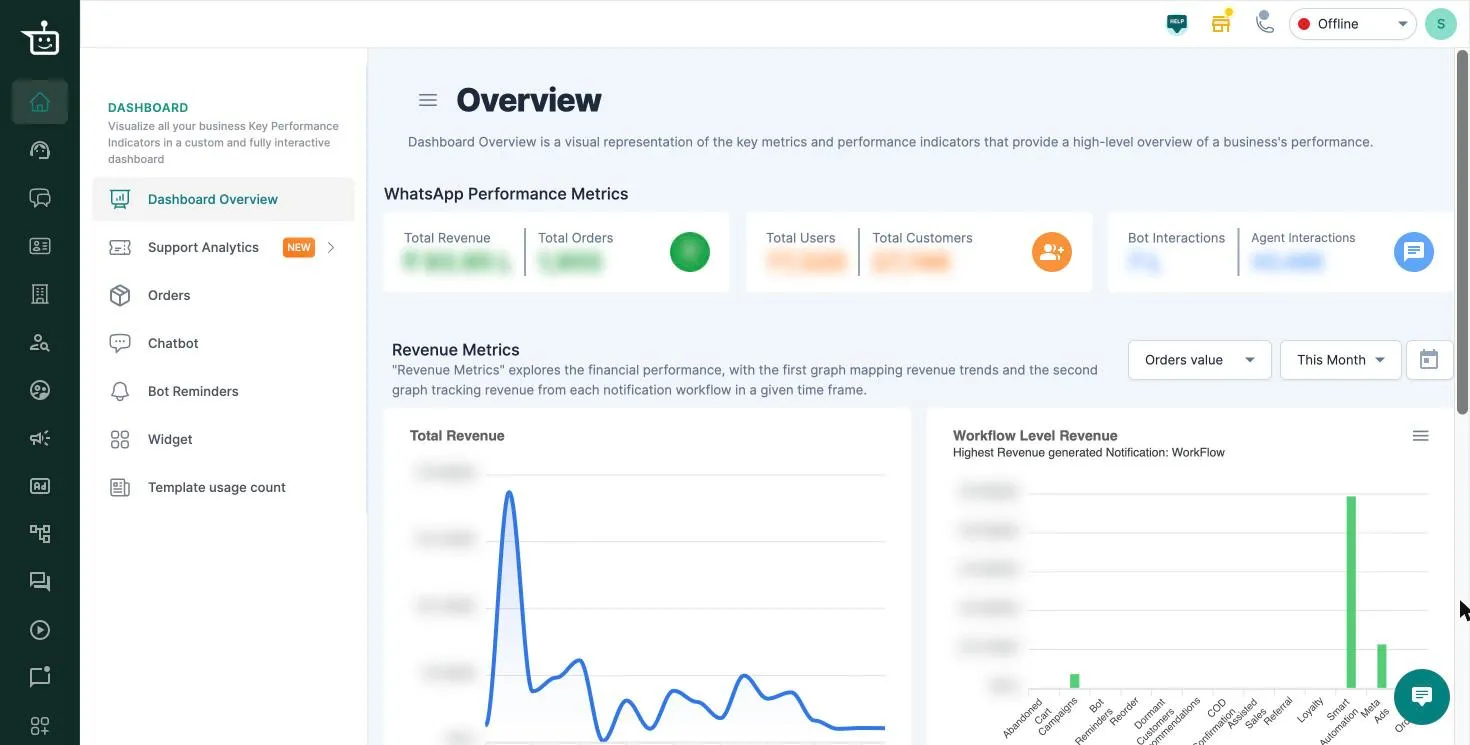
WhatsApp Performance Metrics
Section titled “WhatsApp Performance Metrics”The tiles at the top show your all-time totals. They don’t change when you pick a date range further down the page.
| Tile | What it counts |
|---|---|
| Total Revenue | Value of all orders recorded for your store |
| Total Orders | Number of all orders recorded for your store |
| Total Users | People who have messaged you on WhatsApp |
| Total Customers | People who have placed an order with you |
Users vs customers: a user is anyone who has messaged your WhatsApp number. A customer is anyone who has ordered, through any channel. So someone who ordered on your website but never messaged you is a customer but not a user.
For ticket and chat activity, use Agent Analytics and Bot Analytics.
Revenue Metrics
Section titled “Revenue Metrics”Two charts for the date range you pick (This Month by default, or click the calendar for a custom range):
- Total Revenue: revenue over time.
- Workflow Level Revenue: revenue from each BusinessOnBot feature, so you can see which one earns the most. The top of the chart names the highest earner.
Use the Orders value dropdown to switch both charts between revenue and number of orders.
How an order is credited to a workflow
Section titled “How an order is credited to a workflow”For most workflows, an order counts when the customer read (or, for some messages, received) a message from that workflow in the 72 hours before ordering. If several workflows messaged them, the most recent one gets the credit.
| Workflow | Orders it counts |
|---|---|
| Abandoned Cart | Orders after an abandoned cart reminder |
| Campaigns | Orders after a campaign message (7 days for AI Voice campaign calls) |
| Bot Reminders | Orders after a bot reminder |
| Reorder | Orders after a reorder reminder |
| Dormant Customers | Orders after a win-back message to an inactive customer |
| Smart Automation | Orders after a Smart Automation message |
| Meta Ads | Orders after a message from your Meta Ads flow |
| Bot Orders | Orders placed in the WhatsApp bot or BusinessOnBot checkout |
| COD Confirmation | Cash-on-delivery orders the customer switched to prepaid |
| Assisted Sales | Orders your agents created for customers |
| Referral | Orders from customers who joined through a referral |
| Loyalty | Orders that used loyalty points or a loyalty discount code |
| Recommendations | Orders where the customer added a product the bot recommended |
Revenue figures are refreshed twice a day, so today’s numbers can lag by a few hours.
Acquisition metrics
Section titled “Acquisition metrics”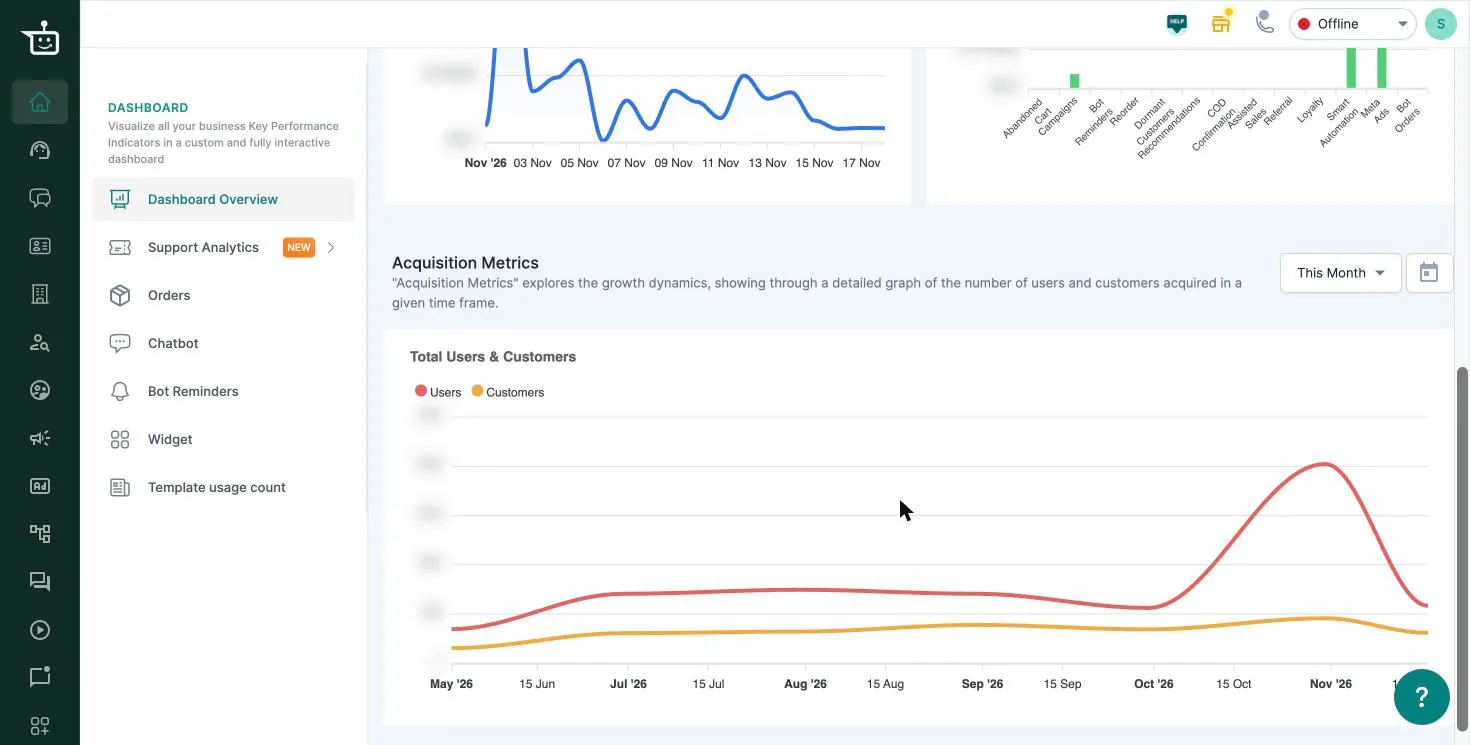
New users (first WhatsApp message) and new customers (first order) in the range you pick.
- To download a chart’s data, click the menu icon (☰) on the chart.
- Comparing months? Pick the same range on both charts so the numbers line up.
Watch the walkthrough
Section titled “Watch the walkthrough”This video shows an older version of the screen. The metrics are the same.
Related
Section titled “Related”Was this page helpful?
Thanks, this helps us improve this page.
Still stuck? Email support@businessonbot.com