

Agent Analytics
Support Analytics, agent performance, ticket analytics, CSAT, first response time, resolution time, leaderboardAgent Analytics shows how your support team is handling tickets: how many came in, how many were resolved, how fast agents replied and how customers rated them.
To open it, go to Dashboard → Support Analytics → Agent.
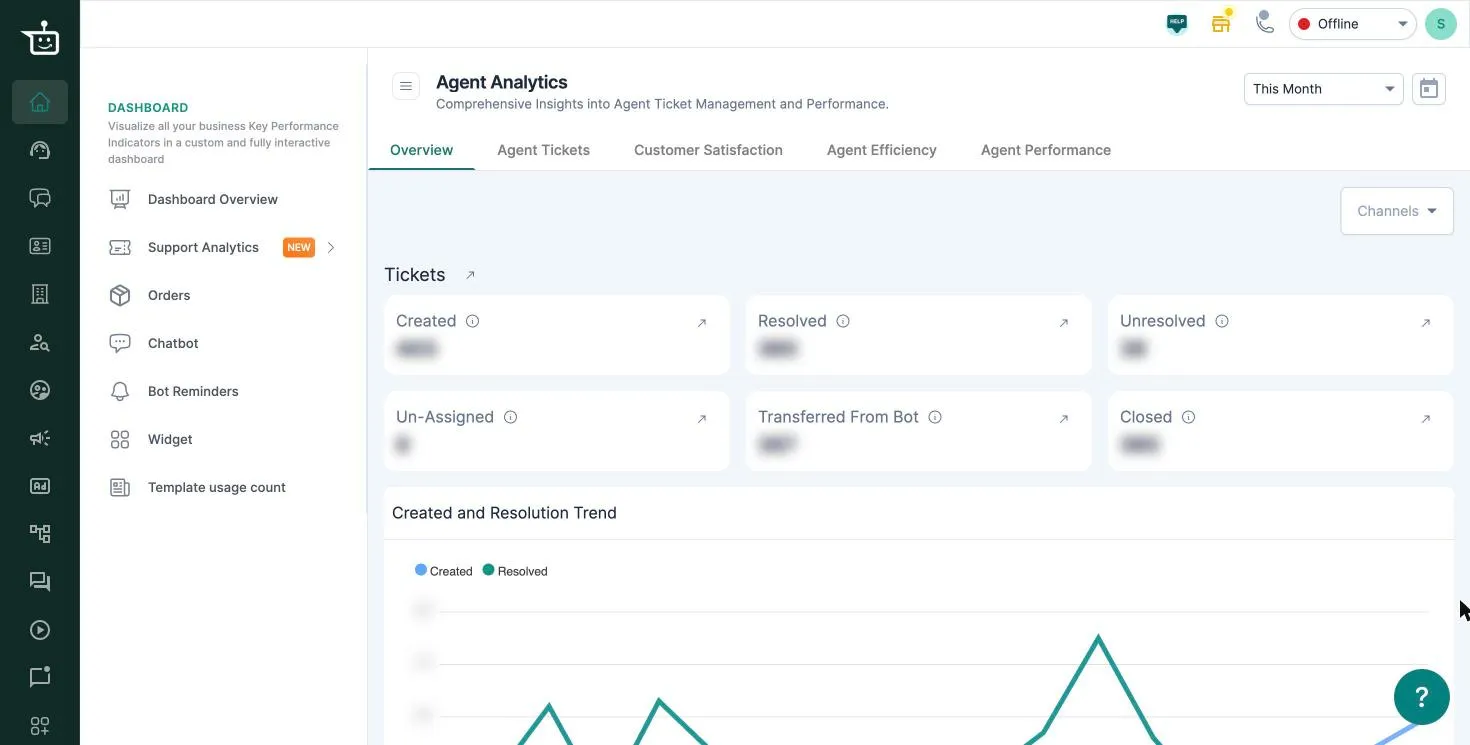
Filters
Section titled “Filters”- Date range (top right): This Month by default, or click the calendar for a custom range. Tickets are counted by the date they were created.
- Channels: limit the numbers to one or more channels, such as WhatsApp or Instagram.
The tabs (Overview, Agent Tickets, Customer Satisfaction, Agent Efficiency, Agent Performance) give a detailed view of each section on the Overview. The ↗ icon next to a section opens its tab.
Tickets
Section titled “Tickets”These tiles count tickets handled by agents that were created in the date range, grouped by where they are now.
| Tile | What it counts |
|---|---|
| Created | All agent tickets created in the range. Created = Resolved + Unresolved |
| Resolved | Tickets now resolved or closed |
| Unresolved | Tickets still open |
| Un-Assigned | Open tickets not assigned to any agent |
| Transferred From Bot | Tickets that started with the bot and were handed to an agent |
| Closed | Tickets now closed |
Because the tiles show each ticket’s current status, the numbers for a past range can change as old tickets get resolved.
Created and Resolution Trend plots created and resolved tickets day by day.
Agent Performance
Section titled “Agent Performance”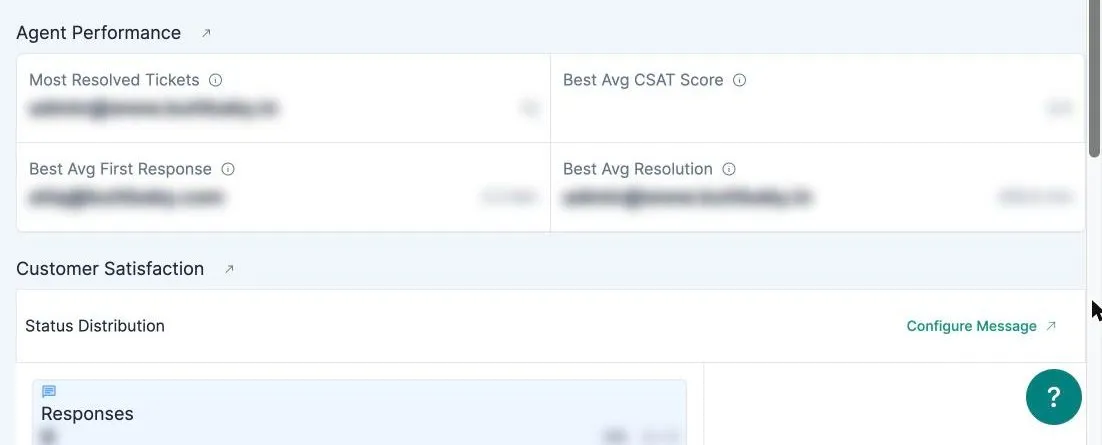
The top agent in the range for each measure:
- Most Resolved Tickets: the agent who marked the most tickets as resolved.
- Best Avg CSAT Score: the highest average customer rating.
- Best Avg First Response: the fastest average first reply.
- Best Avg Resolution: the fastest average time to resolve.
Customer Satisfaction
Section titled “Customer Satisfaction”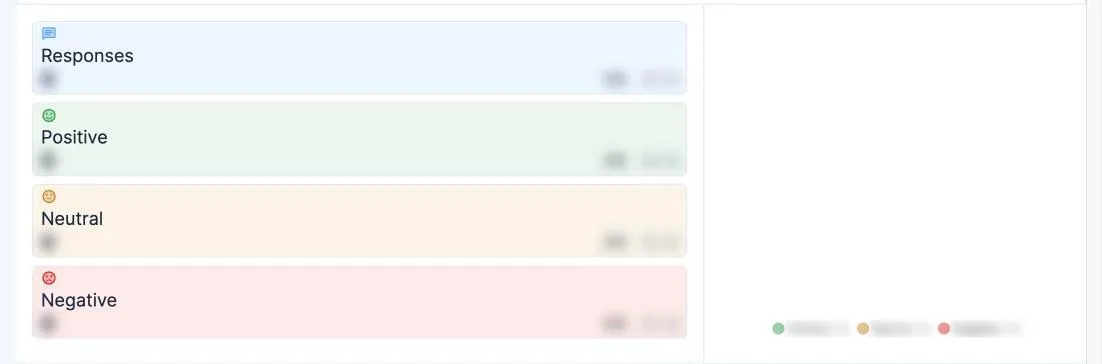
After an agent closes a ticket, BusinessOnBot can send the customer a WhatsApp message asking them to rate the conversation. Status Distribution shows how many customers replied (Responses) and how many replies were Positive, Neutral or Negative.
To change the rating message, click Configure Message.
Efficiency
Section titled “Efficiency”| Tile | What it measures |
|---|---|
| Avg First Reply | Average time from a ticket being assigned to an agent to the agent’s first reply |
| Avg First Resolution | Average time from assignment to the ticket first being resolved |
| Avg Reopened Tickets Resolution | For tickets that were reopened, average time to resolve them again. Empty if no tickets were reopened |
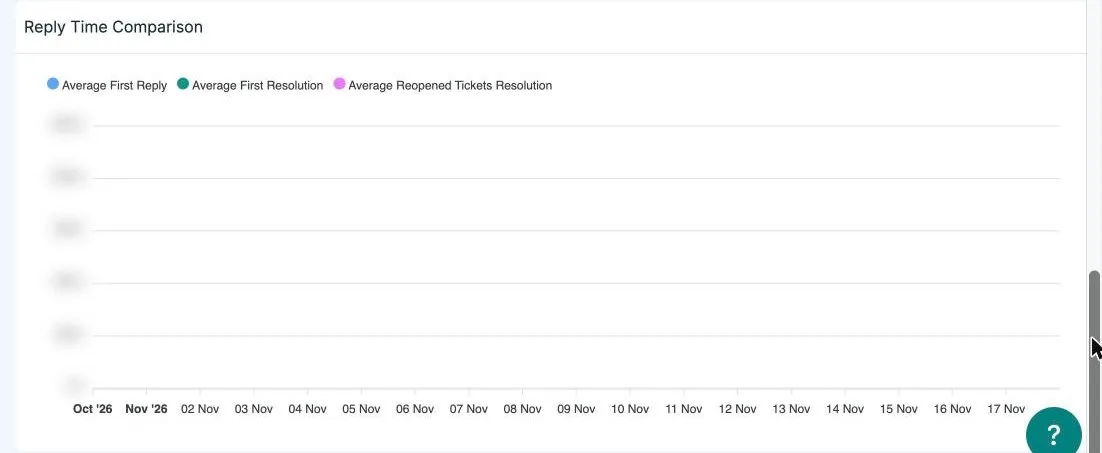
Times are in minutes and count only your business hours, so a ticket that arrives at night isn’t penalised for the hours you’re closed. If you haven’t set business hours, all hours count. Set them in Settings → Business Hours (guide).
Tickets that an agent started (outbound messages) are left out of these times.
Related
Section titled “Related”Was this page helpful?
Thanks, this helps us improve this page.
Still stuck? Email support@businessonbot.com